Back to home

Team
1 Designer
1 product Manager
2 Software Developers
1 QA Assurance Analyst
Status
Shipped
My Role
Solo Designer
Duration
4 months
Year
2022
The Context
The Problem
The Objective
The Design Process
Discover
Actors Involved
In-depth Interview
Conceptualize
Understand key points & Insights
Classify insights
Present to stakeholders
Design
Userflows
Wireframes
Prototype
Discover
Conceptualize
Design
Actors Involved
Existing router holders
Potential customers in remote and urban areas
Interview and Research Insights
High cost of purchasing data for users.
Difficulty locating routers in an area.
What extra value does a router owner get for sharing my internet connectivity.
Router owners want a full breakdown of router details shown
Most users have a preferred internet service provider
Discover
Conceptualize
Design
How might we:
Help customers locate devices nearby?
Offer assistance to routers owners financially?
Break down device usage?
Differentiate between internet service providers?
Solutions
Solution 1:
if we add the ability to visualize all routers on a map and also sort by a person’s location
Result
Then it will be easier for users to locate nearby routers
Solution 2:
If we showcase the token distribution transparently to hub owners through a leaderboard
Result
Then we will be able encourage router owners to offer more services and make the process competitive
Solution 3:
if we add specific router details to all routers
Result
Then it will be easier to see a full break down of this router’s lifecycle and performance
Solution 4:
If we add a feature that enables a user sort a router based on internet service providers
Result
Then we can make it easier to visualize where these ISPs are located nearby and worldwide
Discover
Conceptualize
Design
Wireframes
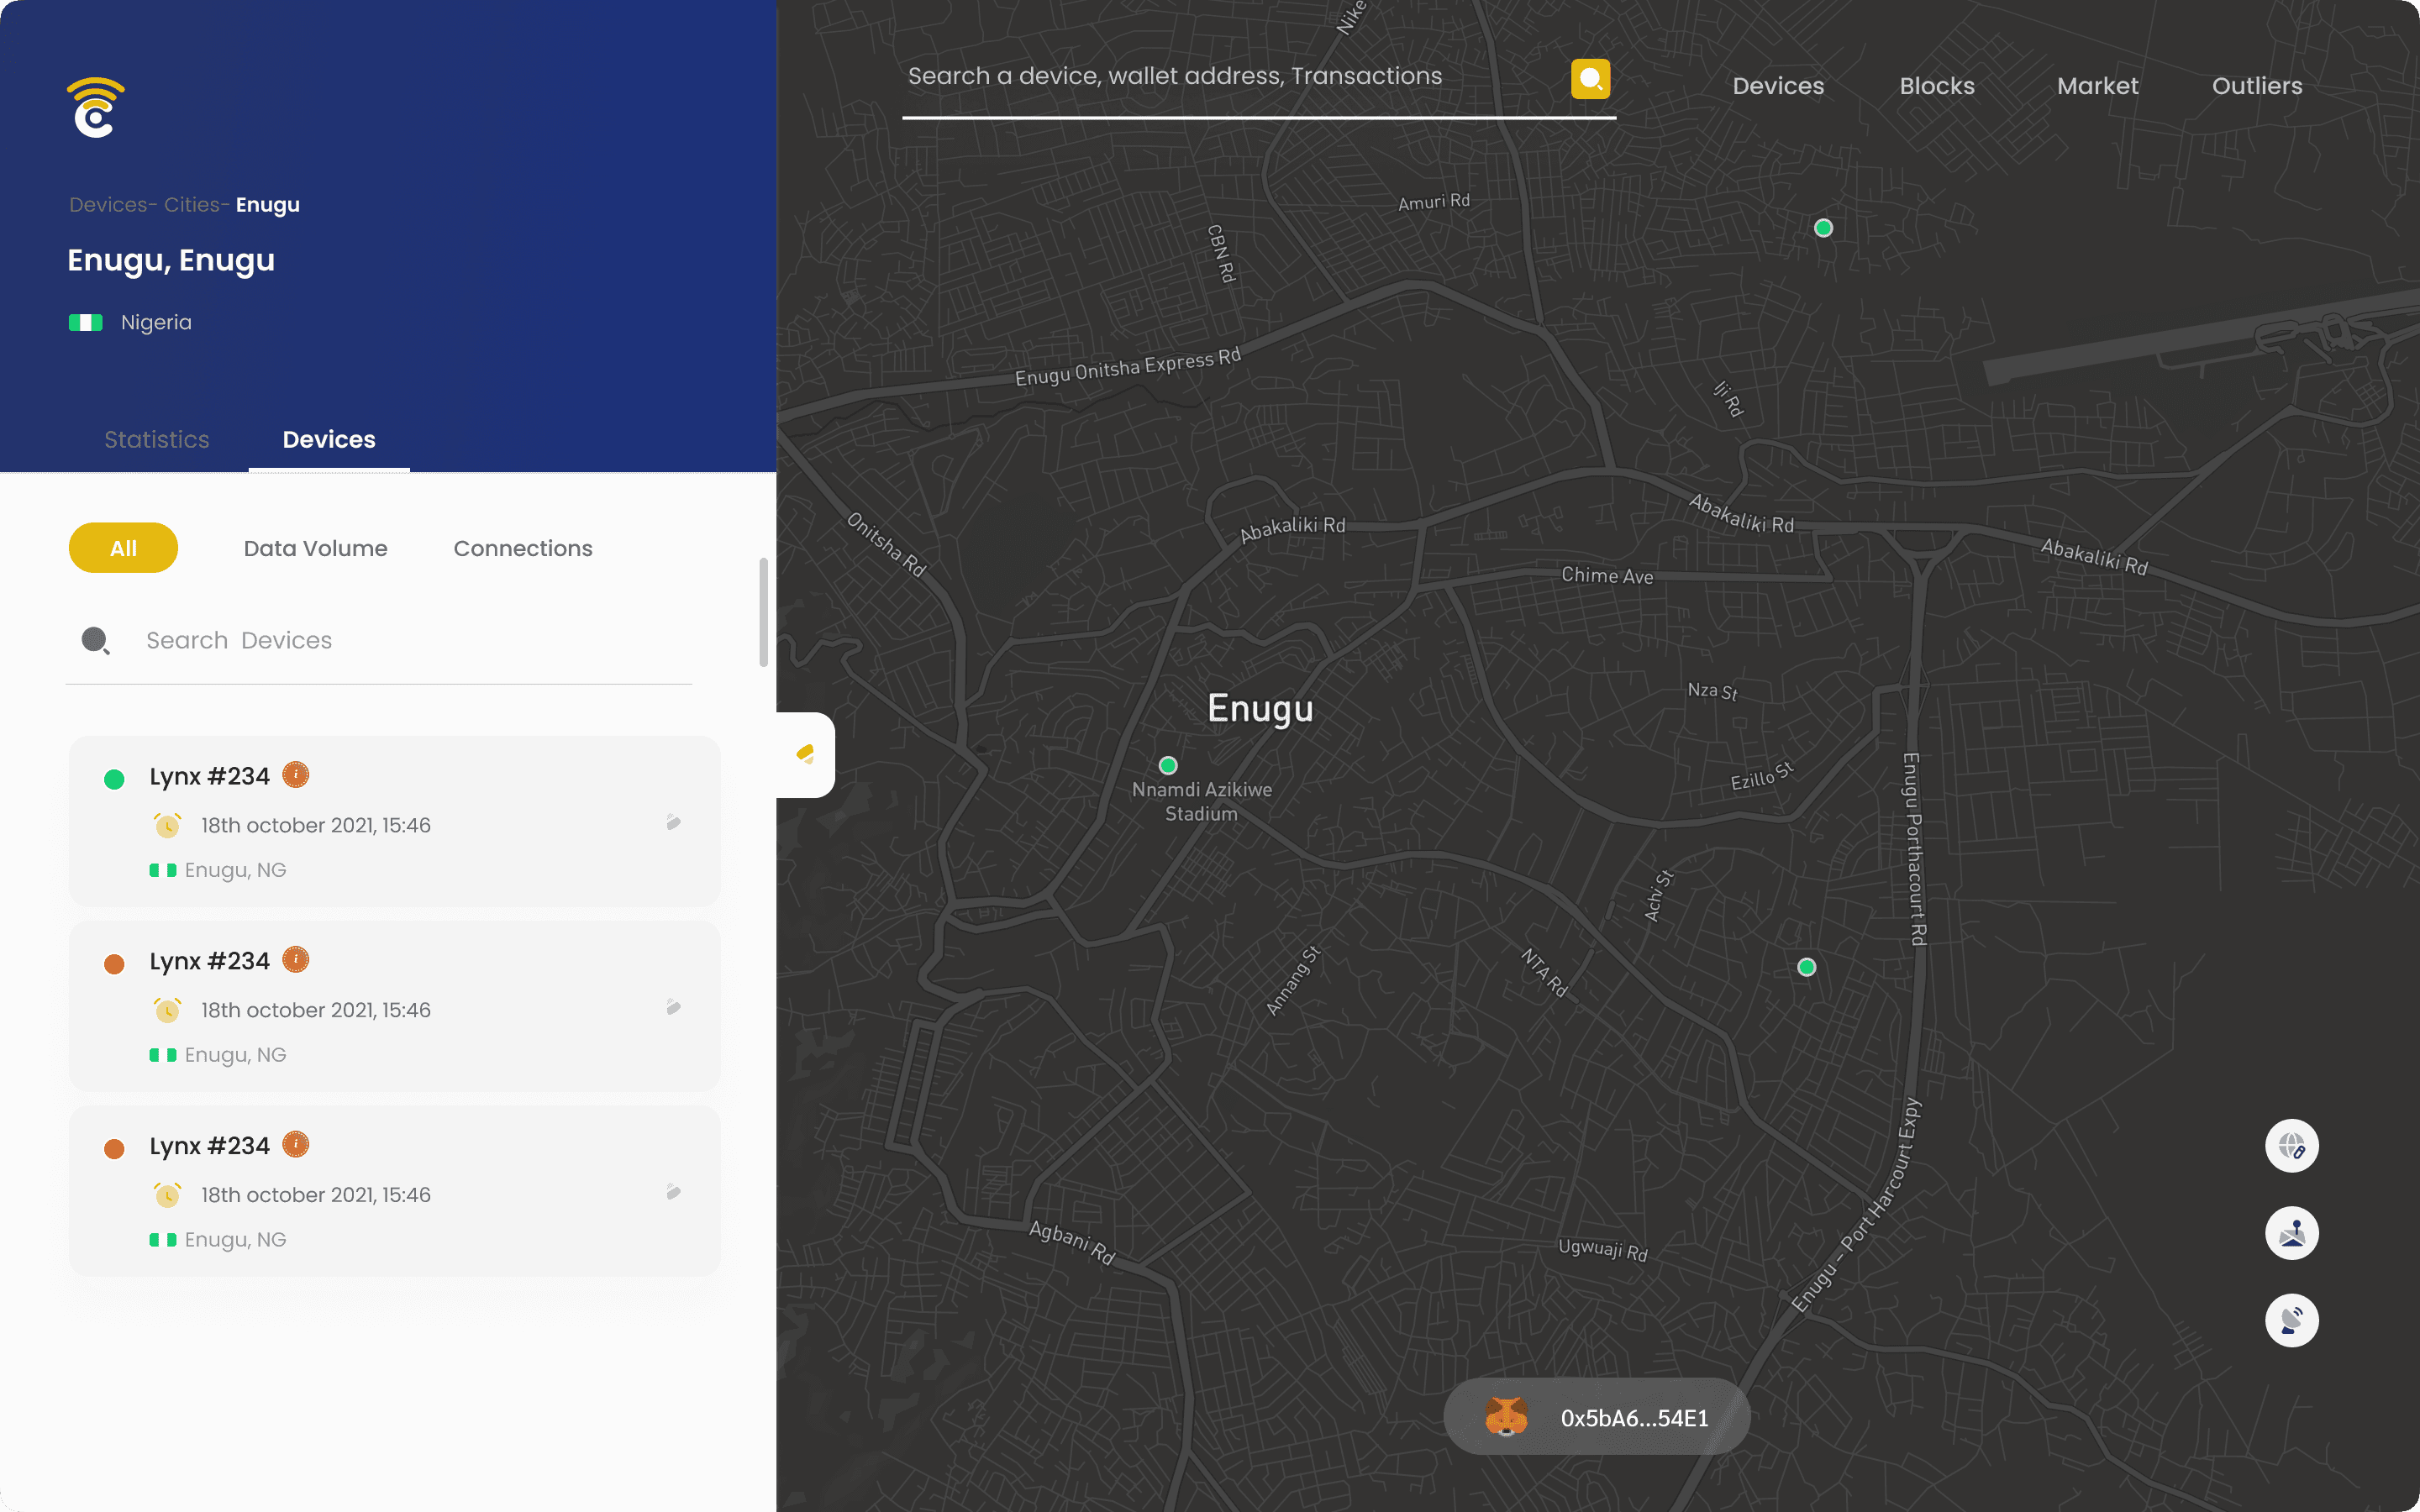
Overview Screens
A brief overview of overall statistics of routers on the network and visibility of nearby routers


Routers are green beeping beacons when active
A full map of the world. which can be zoomed in and out

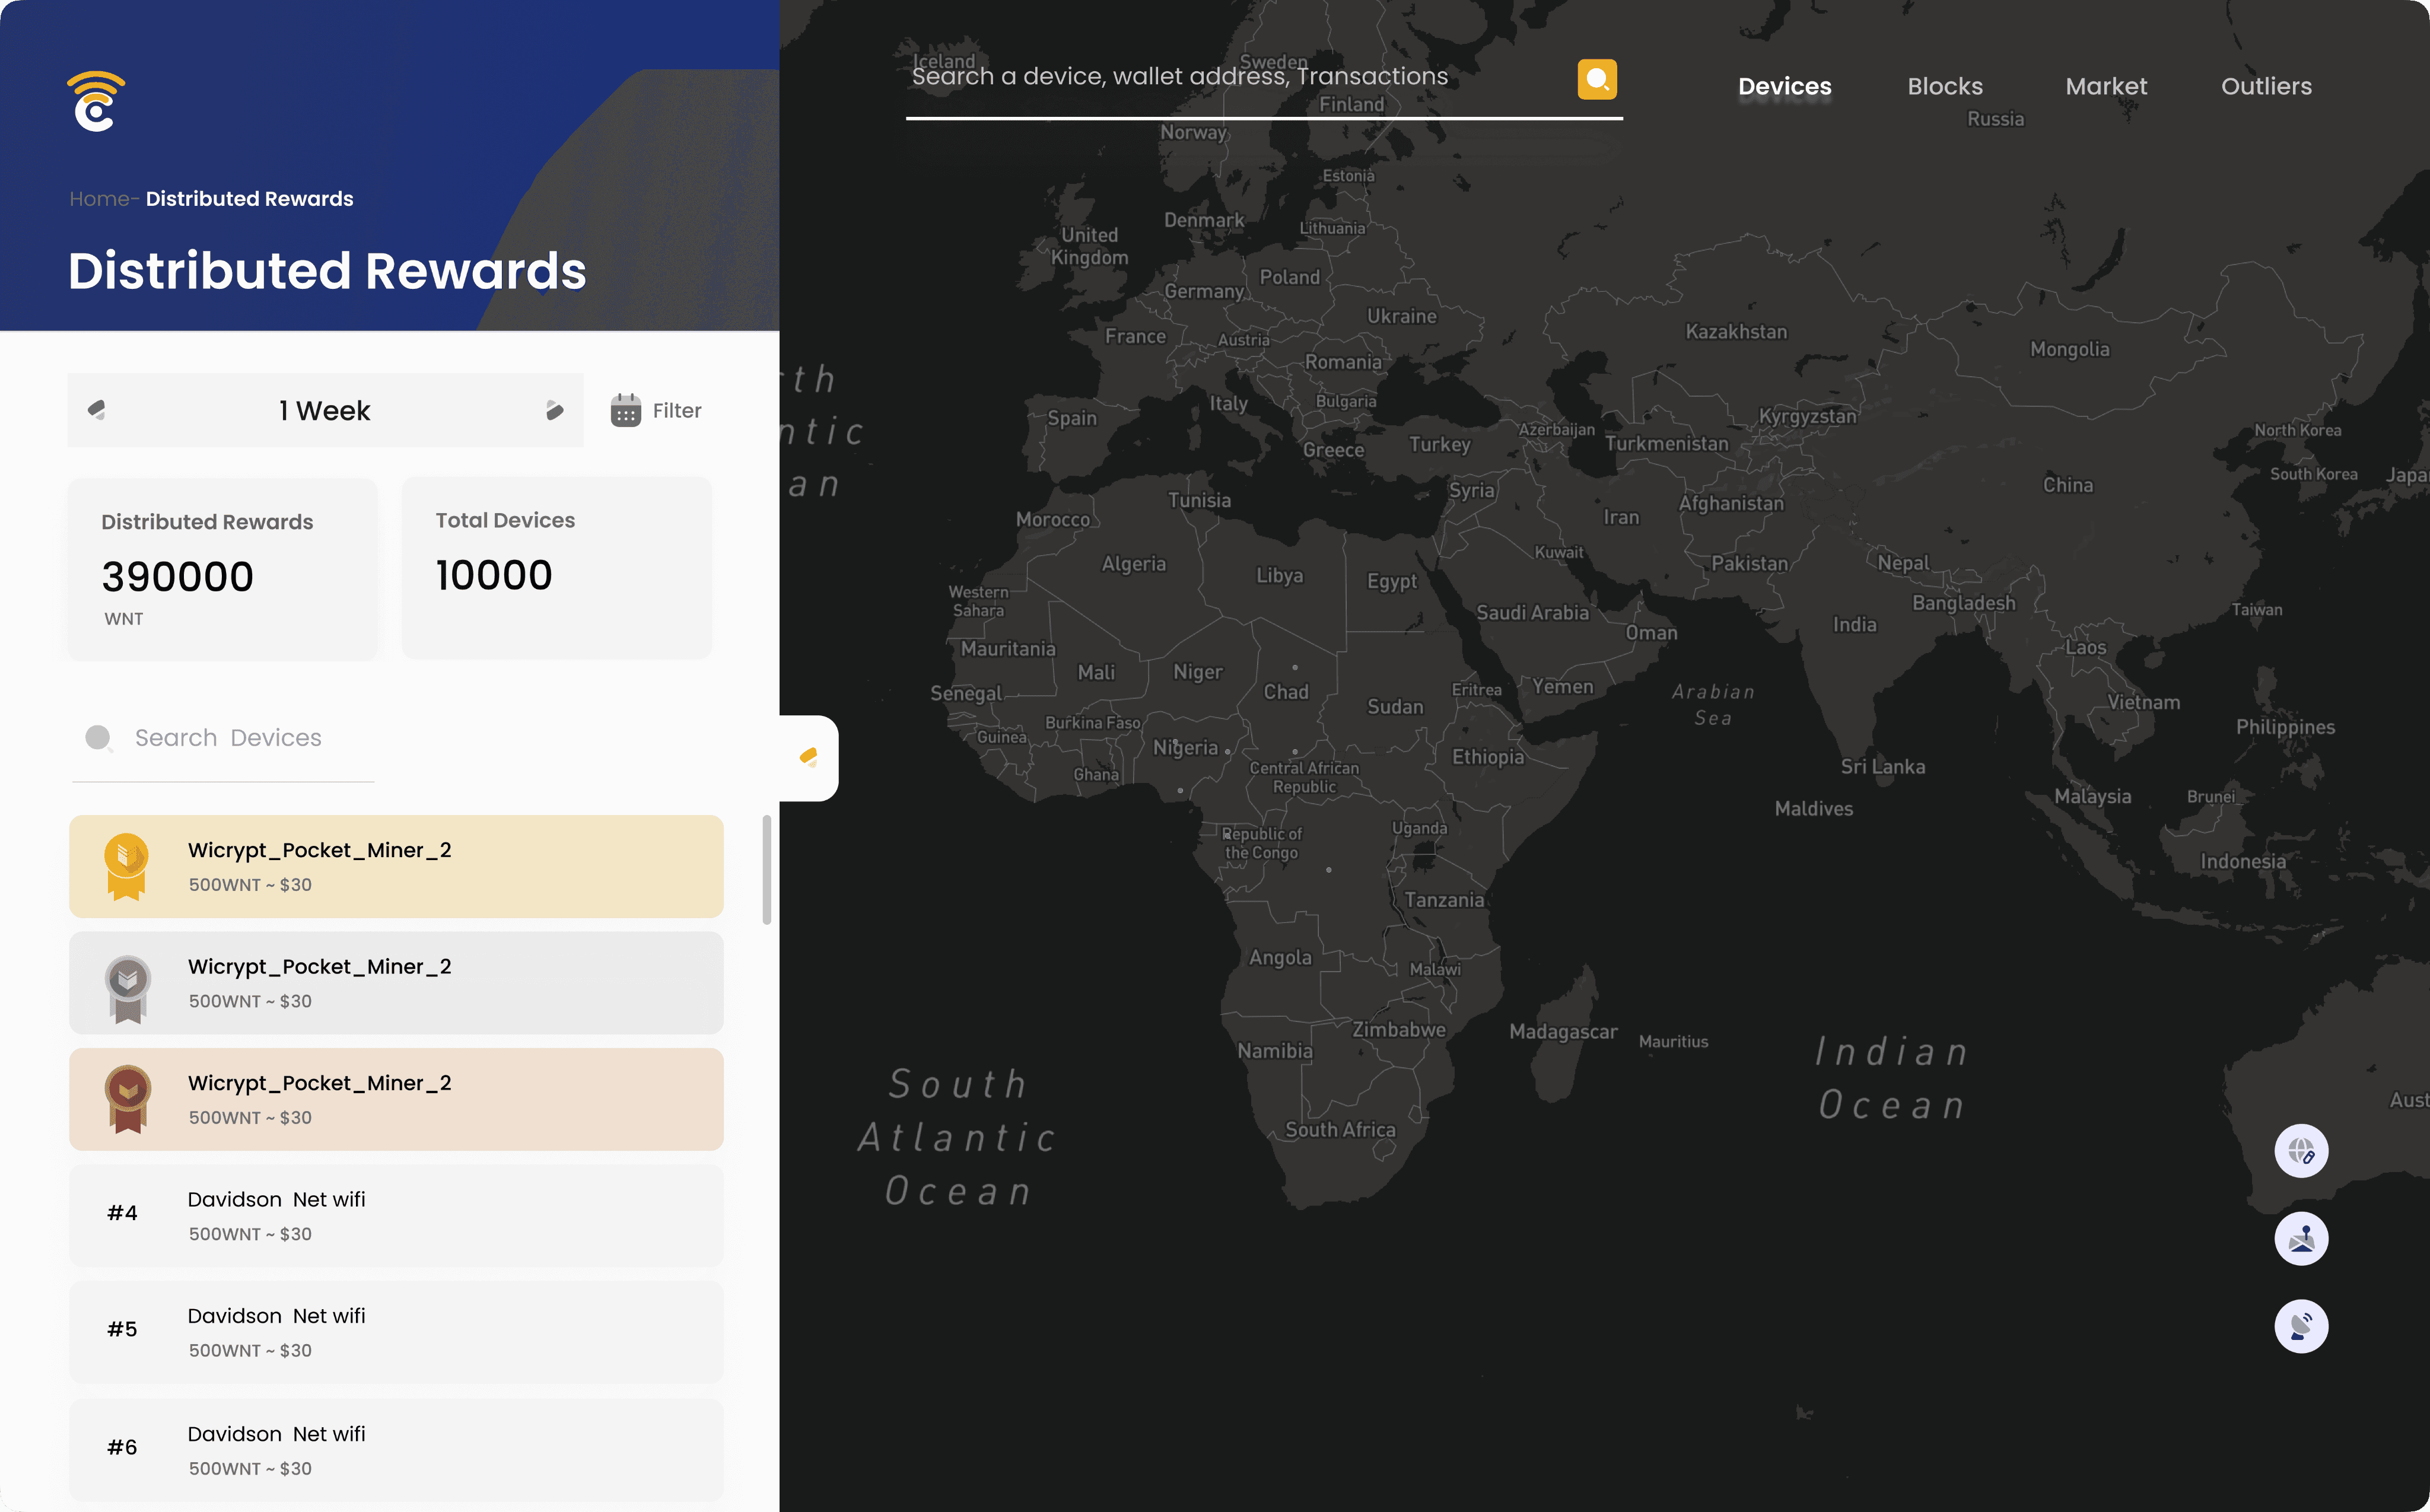
Reward Distribution
For transparency and encouragement, users get to see how everyone earns in a week.
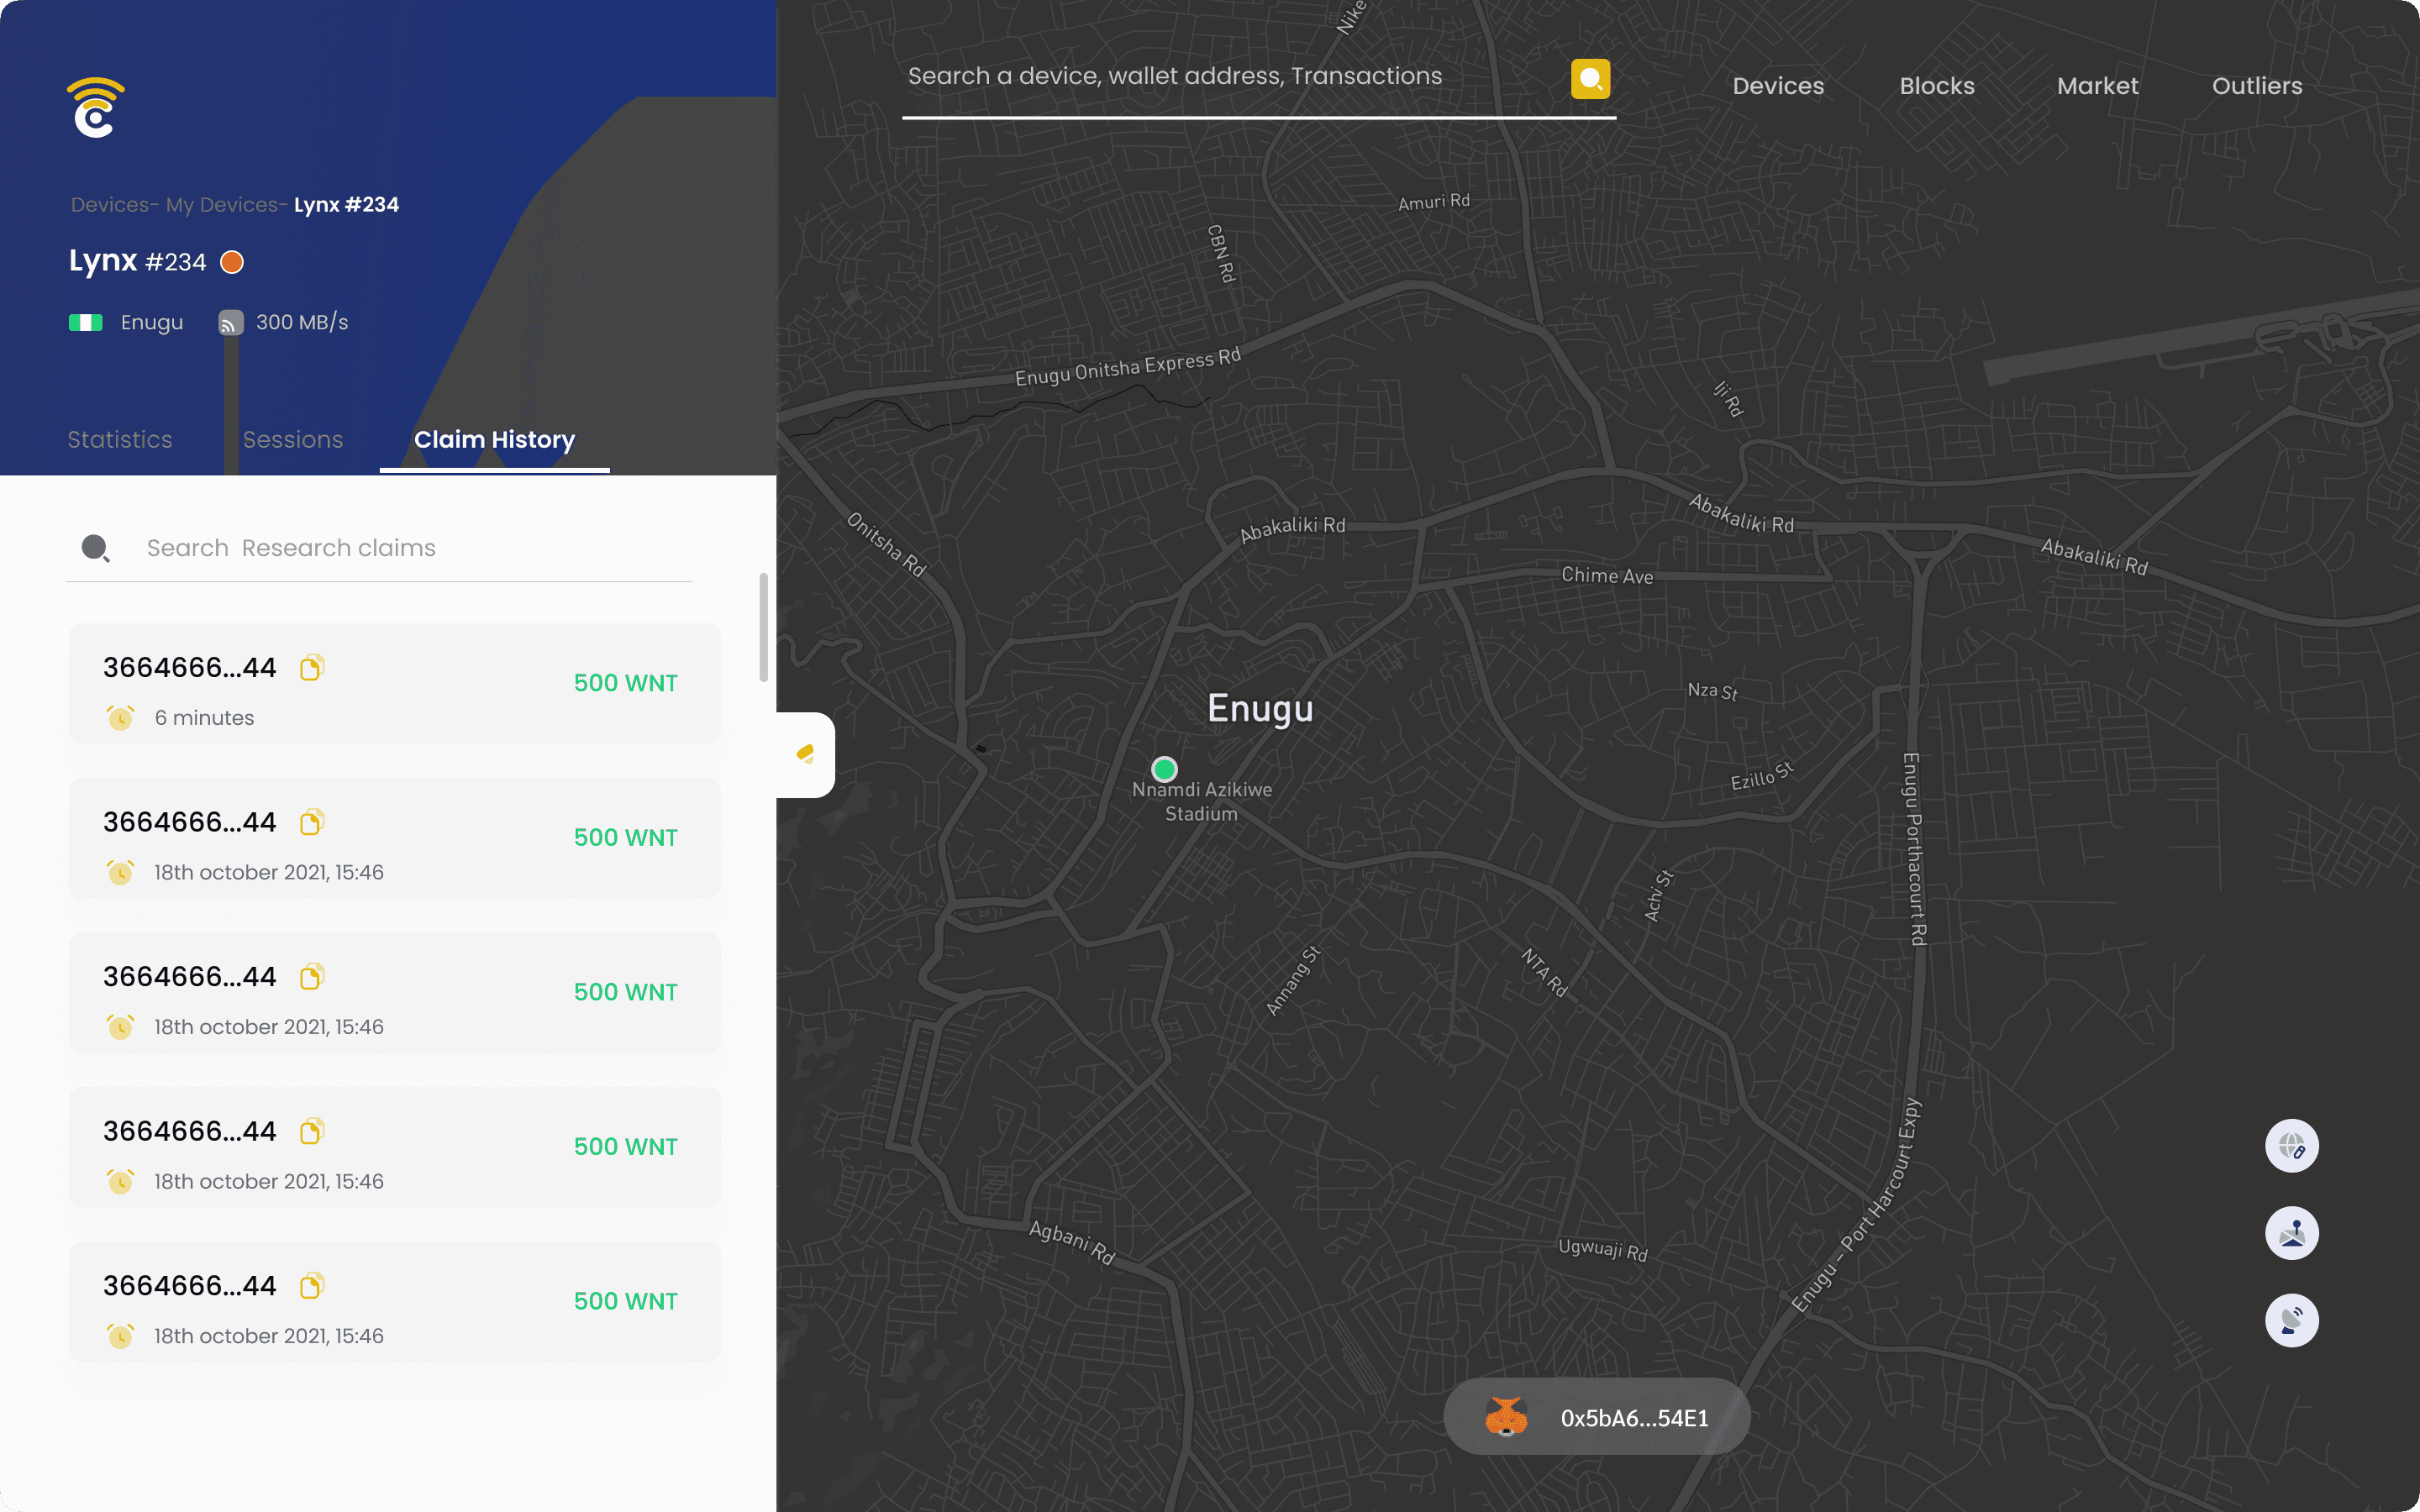
Router Details
Here router/device owners can see important details of a connected device

Internet Service Providers
List of ISPs on the platform can be accessed easily from here

Users can select and view a router/device with a preferred Internet service provider

Additional Screens
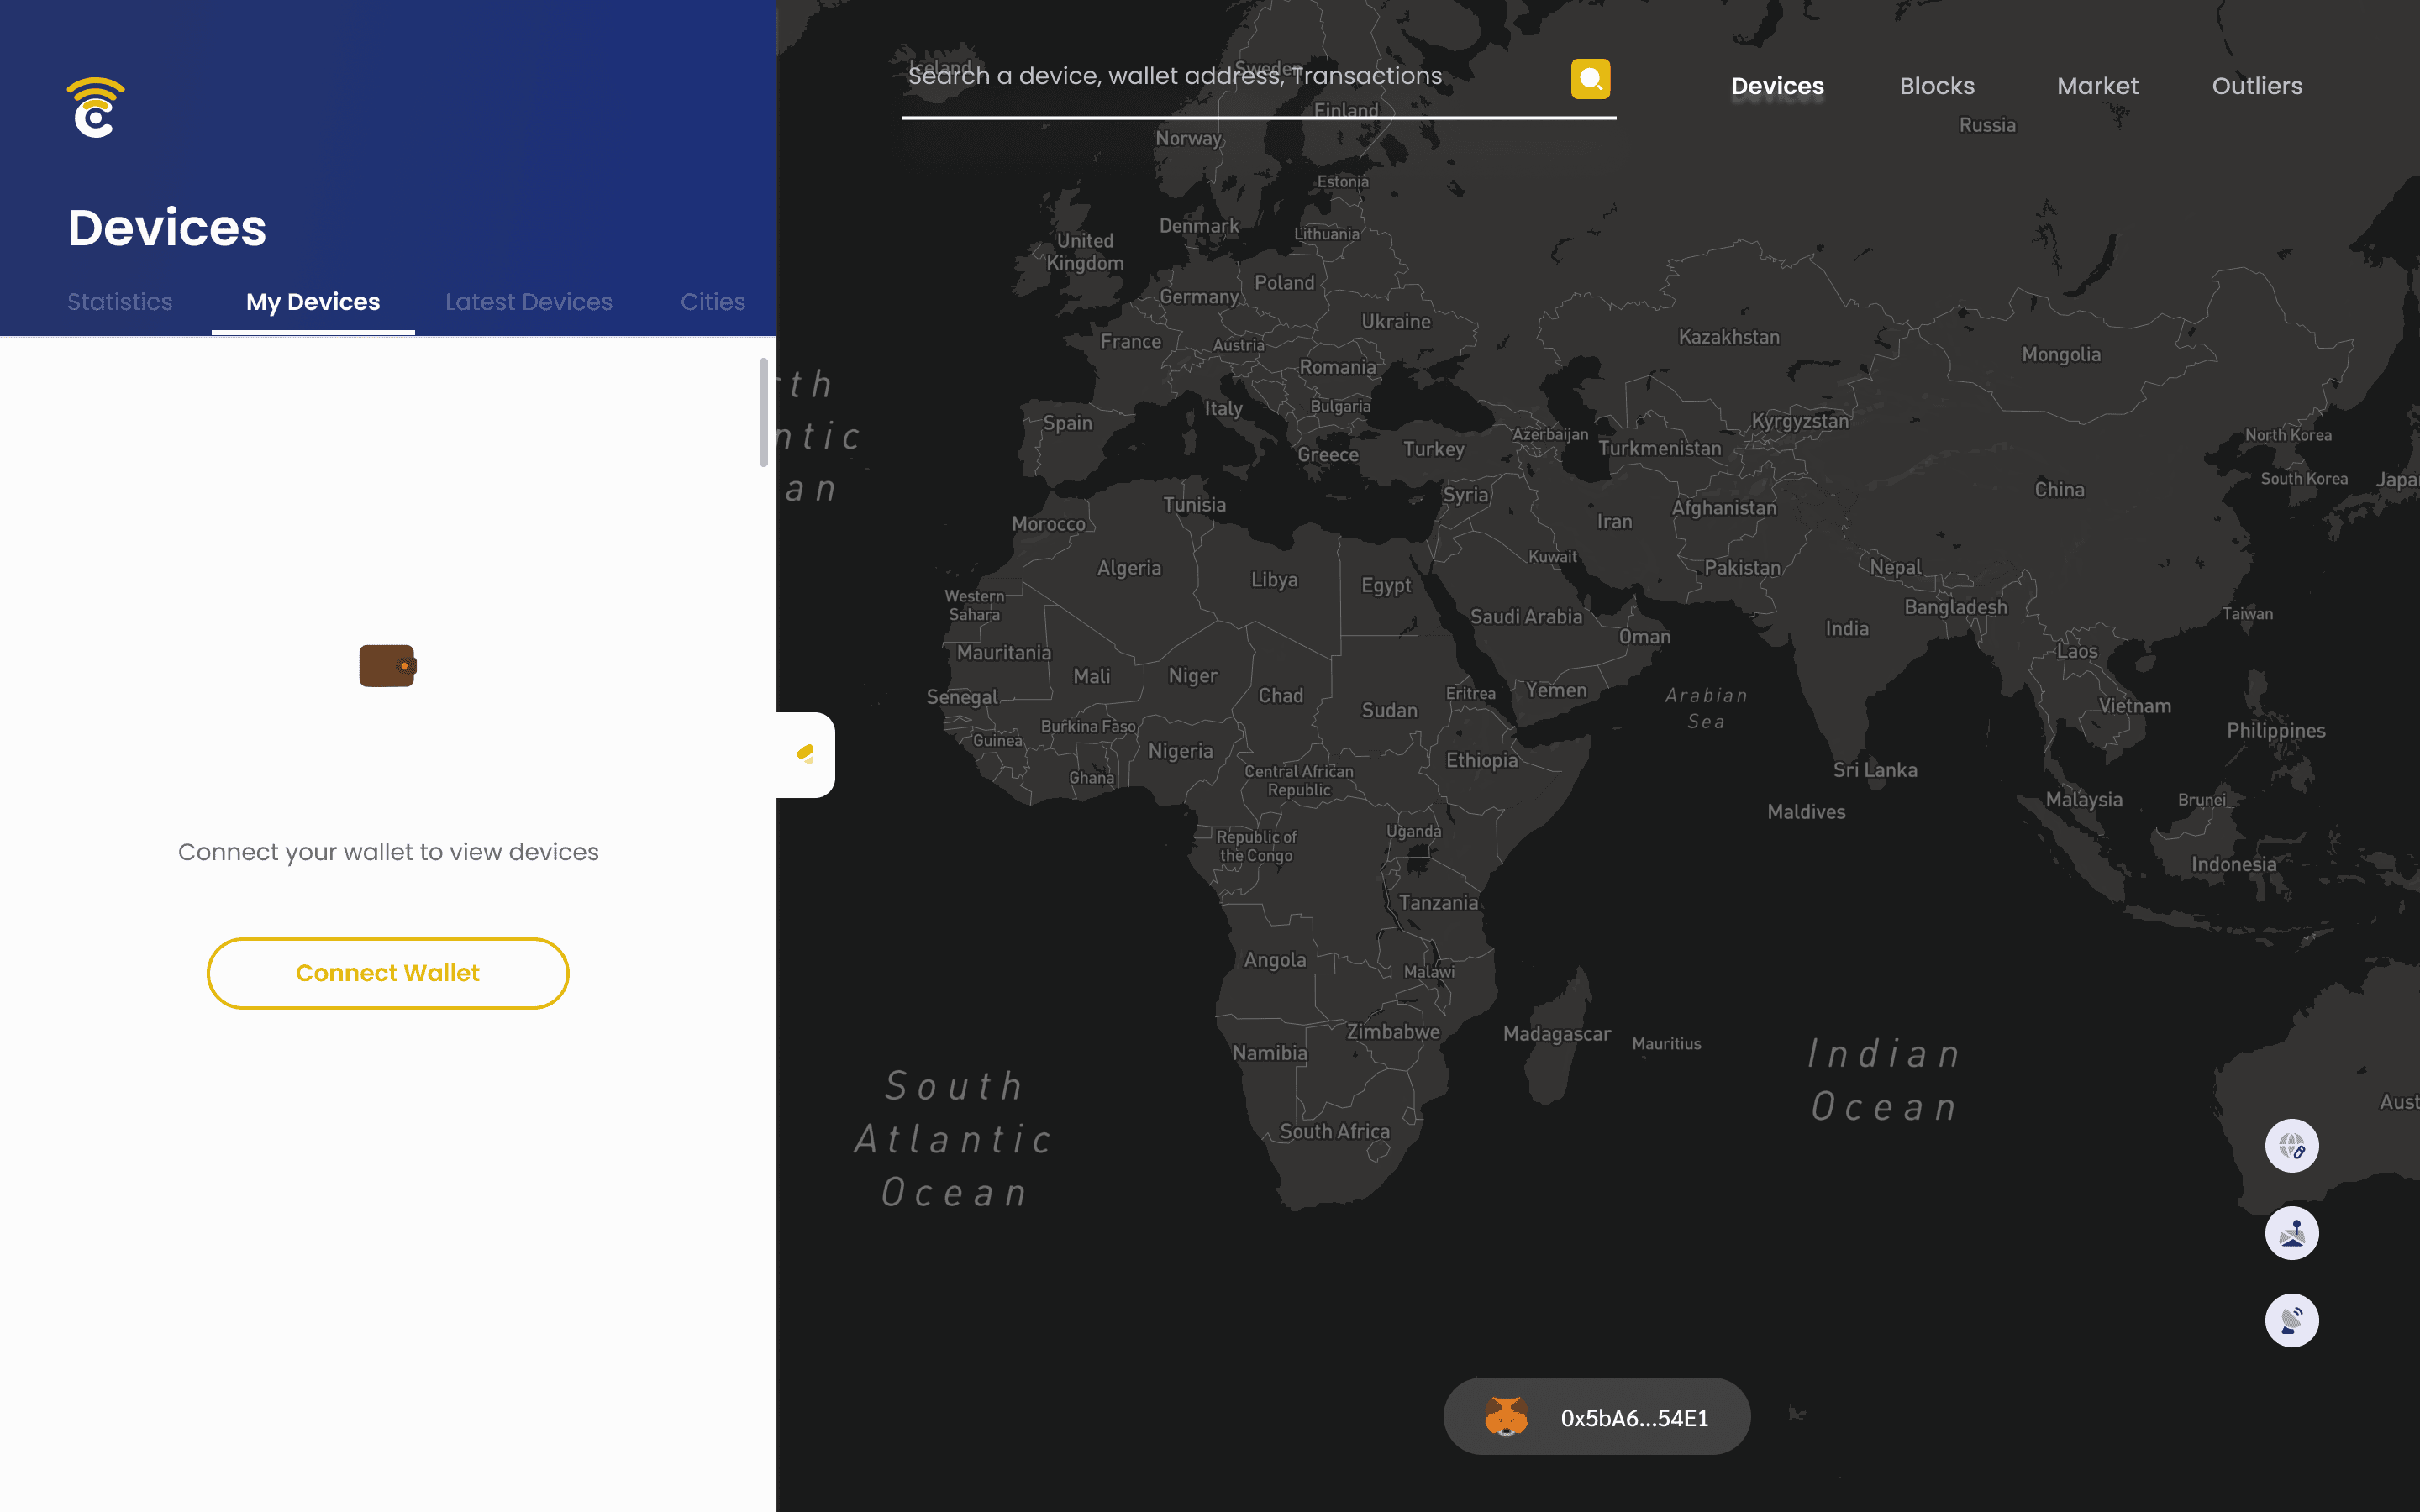
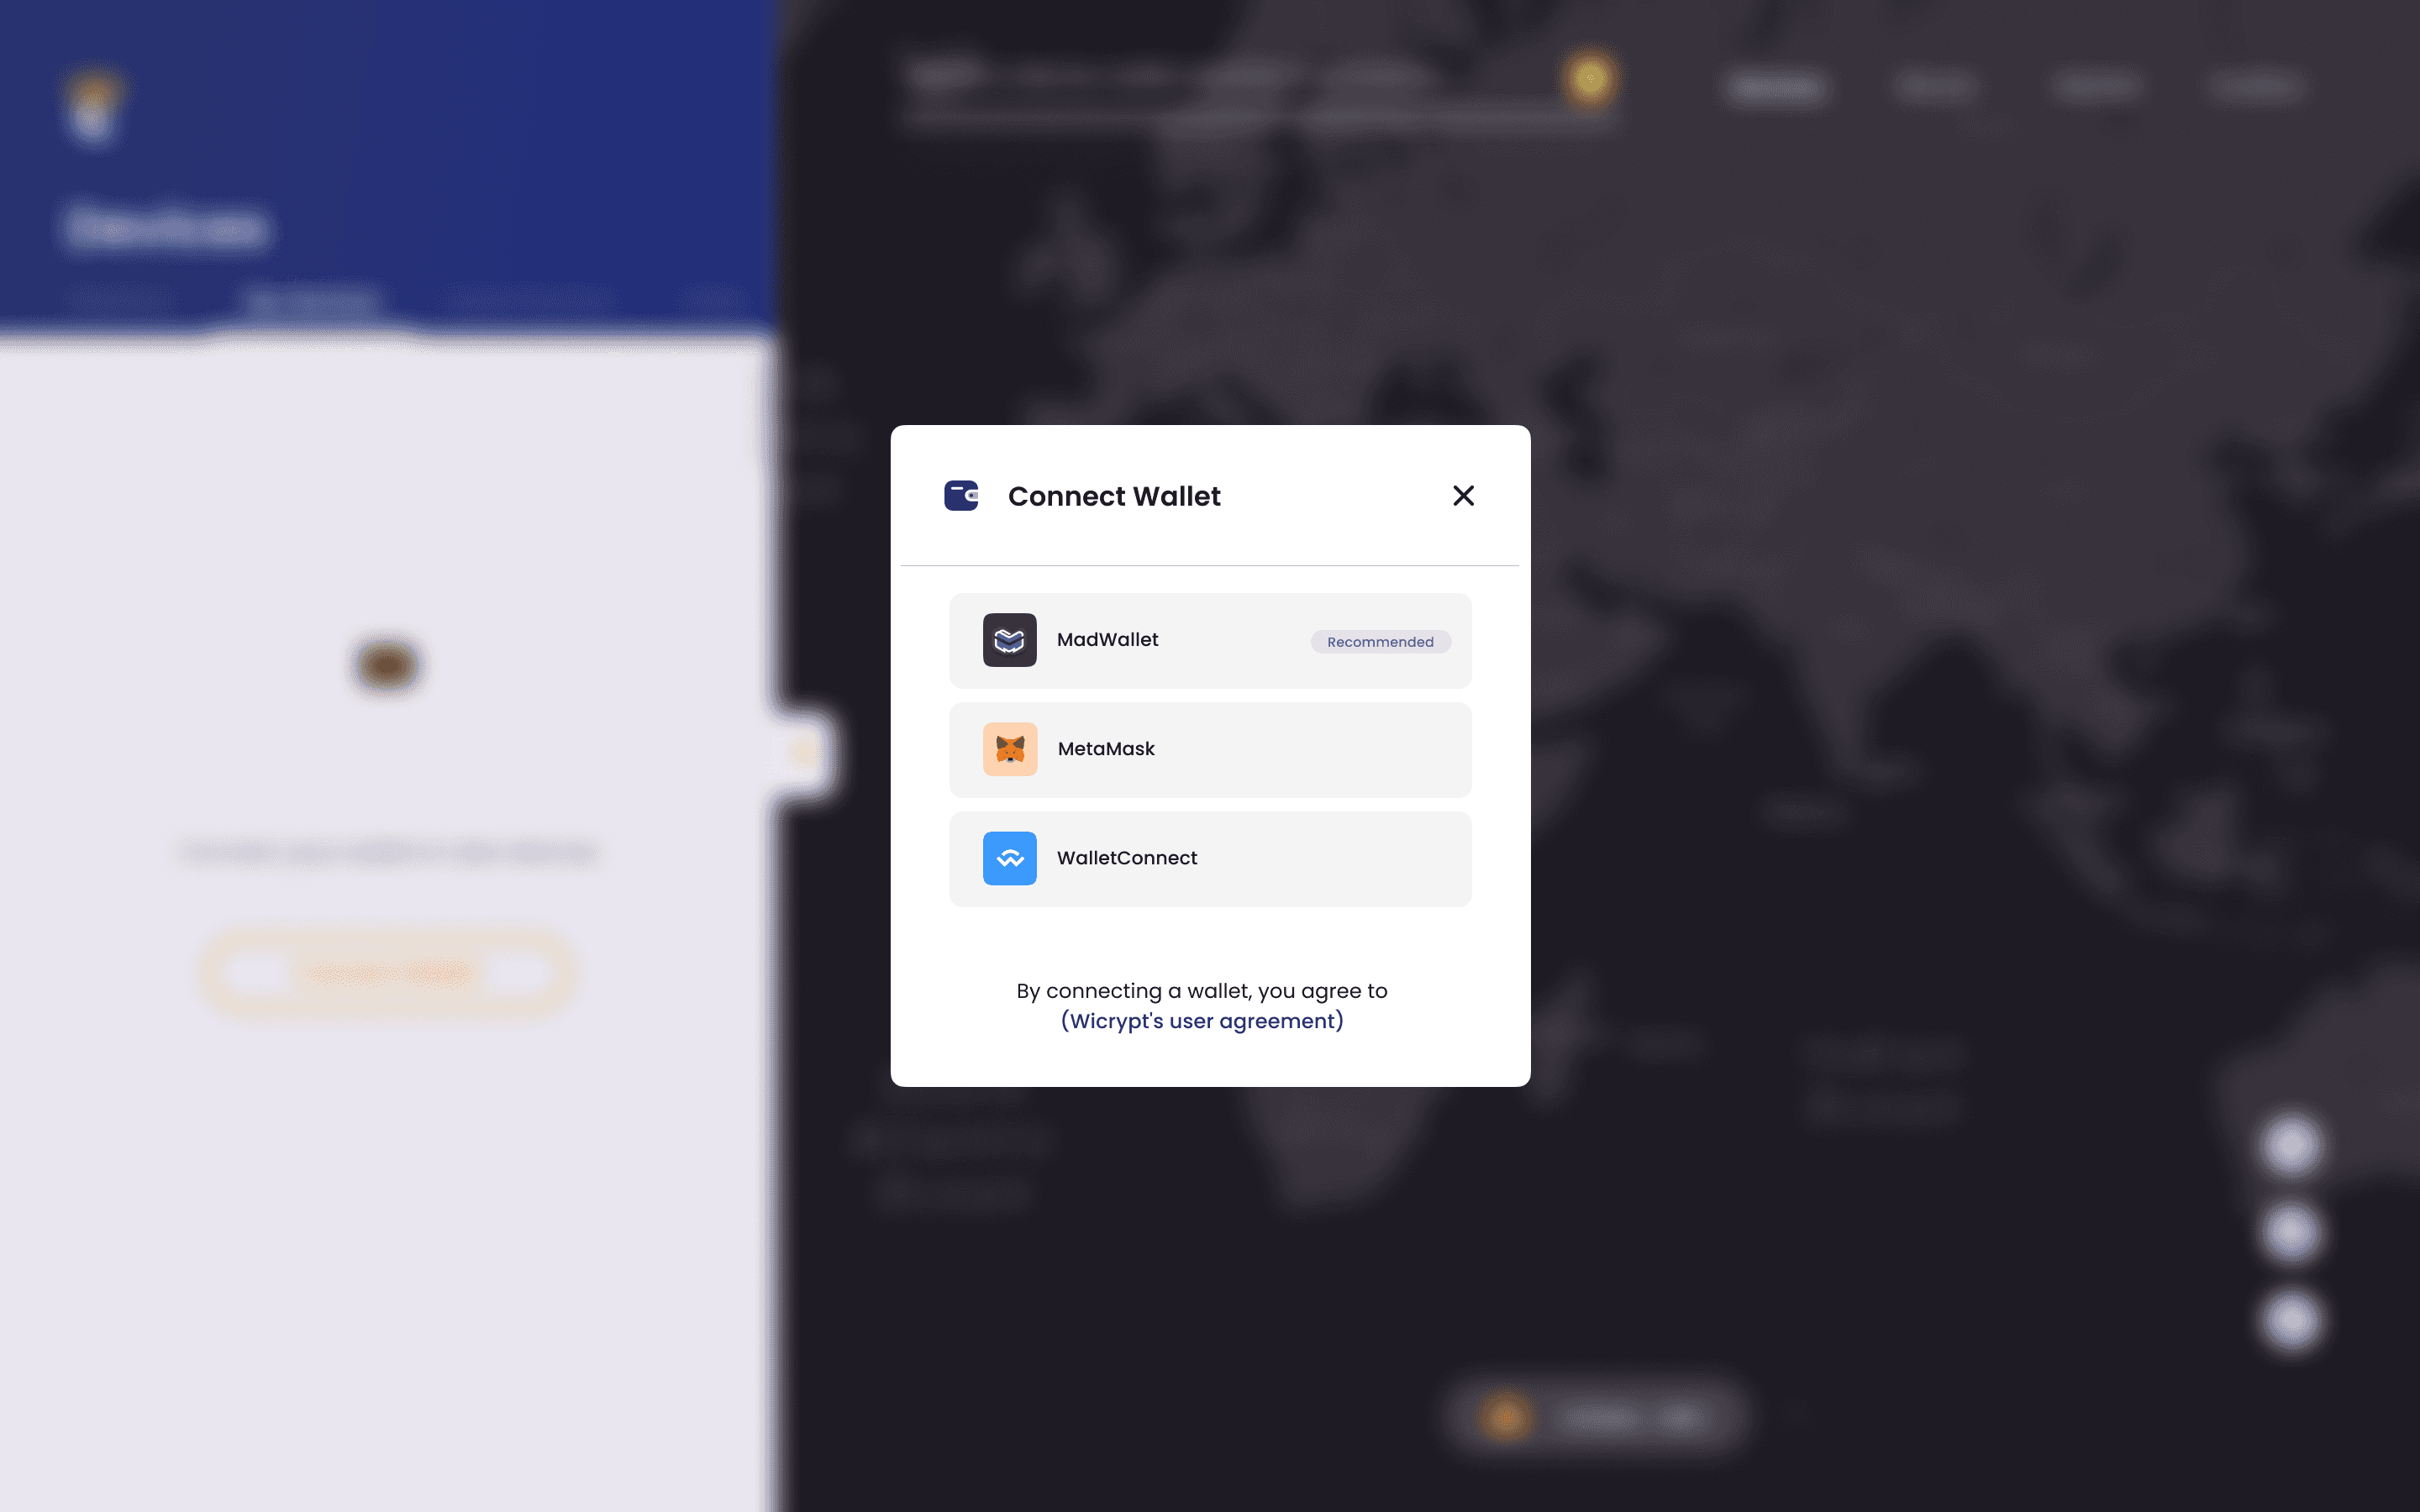
Here router owners get to connect to wallet to view their device details
Outcomes
Thanks for visiting.
Thanks for visiting my website, if you do find me interesting, let’s get to work together on your next project
